Figure 7.

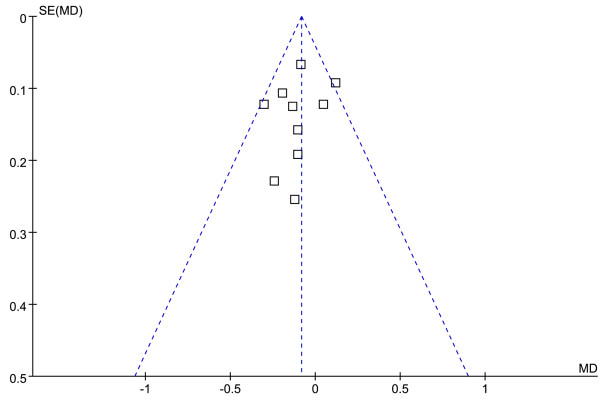
Funnel plot of the association between APOM T-778C polymorphism and serum LDL-C levels. (genetic model: TT vs. CT + CC).

Funnel plot of the association between APOM T-778C polymorphism and serum LDL-C levels. (genetic model: TT vs. CT + CC).