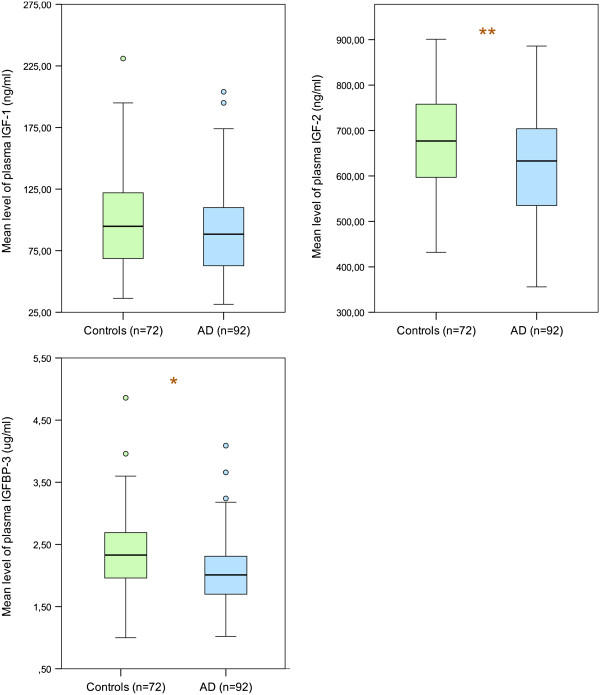
Figure 1.
Concentrations of IGF-I, IGF-II and IGFBP-3 (the most abundant carrier in the bloodstream) in plasma. The lower, upper and middle lines correspond to the 25th percentile, 75th percentile and median, respectively. The whiskers at the top and bottom extend between the 95th and the 5th percentiles. The circles represent outliers. *p < 0.05 and **p < 0.005.

