Fig. 1A.

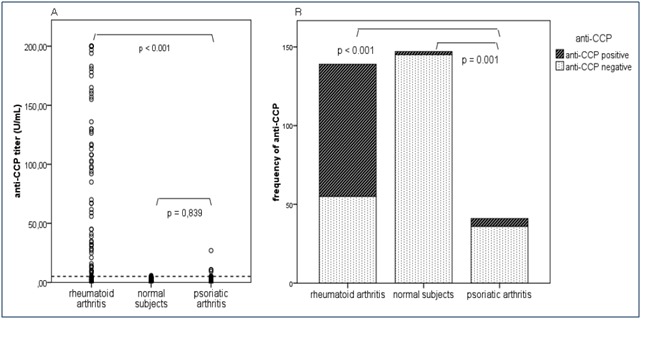
The distribution of anti-CCP titers according to the diagnosis. The dotted line represents the positive cutoff value (5 U/mL). B. The distribution of anti-CCP positivity and negativity according to the diagnosis

The distribution of anti-CCP titers according to the diagnosis. The dotted line represents the positive cutoff value (5 U/mL). B. The distribution of anti-CCP positivity and negativity according to the diagnosis