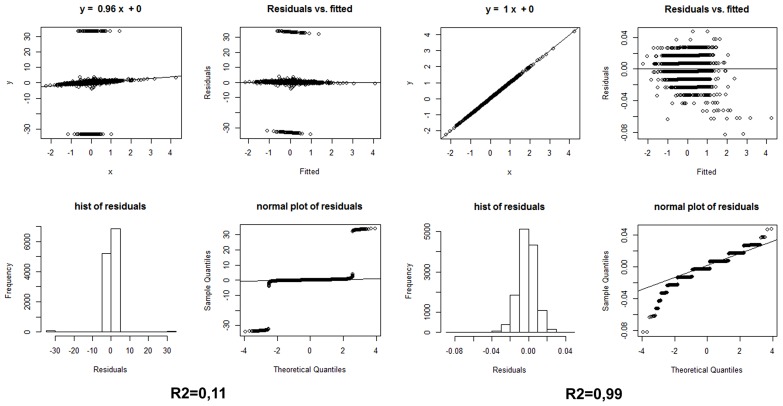
FIGURE 1.
(Left) Statistics on the differential expression results of AD whole transcriptome samples vs. non-demented controls, calculated by edgeR and Cufflink/Cuffdiff, sorted, and compared by Log2 Fold Change only, i.e., without any FDR threshold. (Right) Same statistics on the same samples, using the Log2 Fold Changes elaborated with edgeR and the simple Fisher test procedure described in the text. Hist: histogram.

