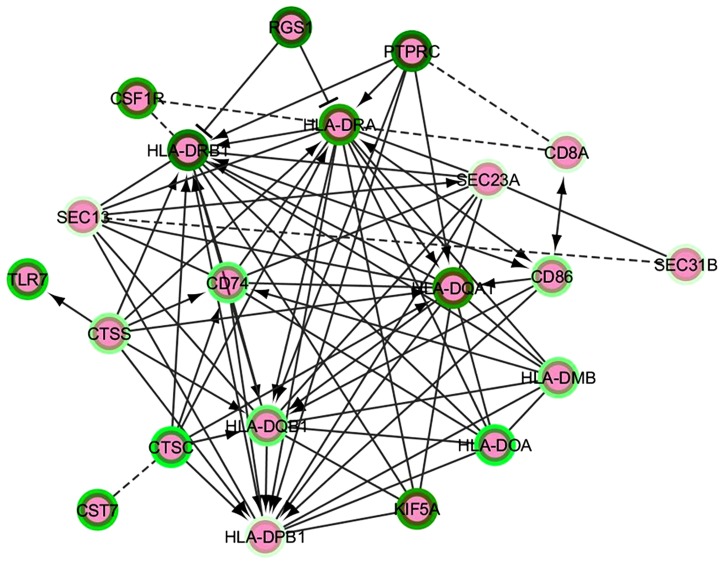
FIGURE 2.
A functional interaction network module from an AD vs. control NGS dataset analysis. The intensity of the green color in the border of the nodes represent the Log2FC – darker green corresponds to minor negative Log2FC, i.e., the most down-regulated genes. The edges represent functional interactions detected between the nodes; these can be non-directed, directed stimulatory (arrows), directed repressor (T-shaped edges) or inferred (discontinuous line edges).

