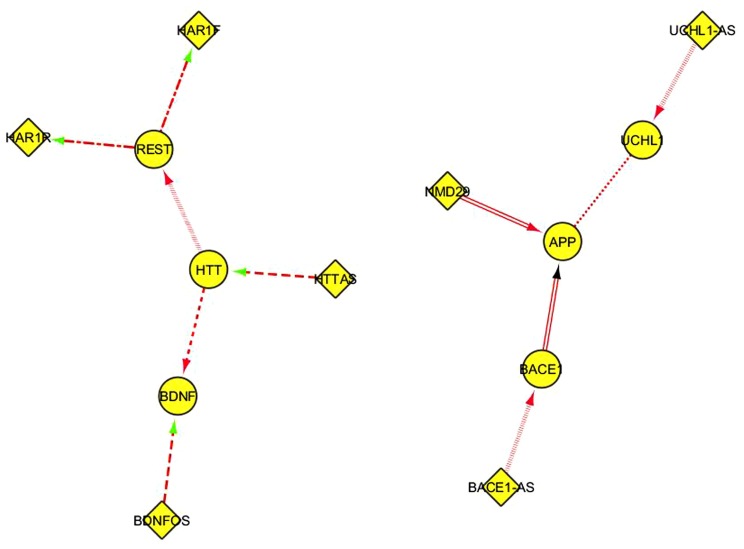
FIGURE 3.
A Cytoscape network representation of ncRNA/coding RNA and coding RNA/coding RNA manually annotated functional interactions described in Table 1. Diamonds represent ncRNA genes, ellipses represent coding genes. The functional meaning of the graphical format of the edges, including the color, is explained in the main text.

