
Table 1.
Distribution of various T3SS types in phytopathogenic and plant-associated bacteria containing atypical T3SSs.
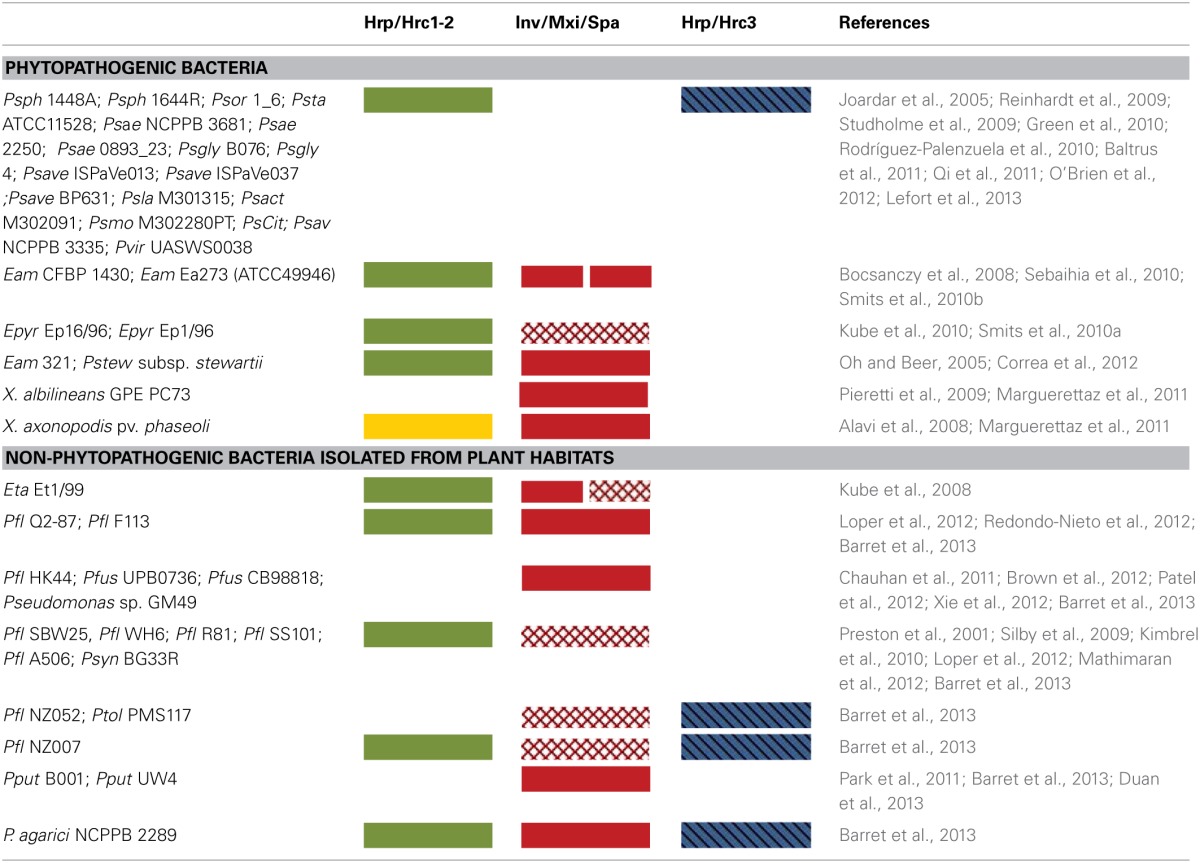
Abbreviations: B. Burkholderia; E., Erwinia; Eam, E. amylovora; Epyr, E. pyrifoliae; Eta, Erwinia tasmaniensis; P., Pseudomonas; Pfl, P. fluorescens; Pfus, P. fuscovaginae; Pput, Pseudomonas putida; Ps, P. syringae; Psyn, P. synxantha; Ptol, P. tolaasii; Psph, Ps pv. phaseolicola; Psor, Ps pv. oryzae; Psta, pv. tabaci; Psae, Ps pv. aesculi; Psae, Ps pv. aesculi str. 2250E; Psgly, Ps pv. glycinea; Psave, Ps pv. avellanae; Psla, Ps pv. lachrymans; Psact, Ps pv. actinidiae; Psmo, Psmo, Ps. pv. morsprunorum; Psav, P. savastanoi pv. savastanoi; Pvir, P. viridiflava; Pstew, Pantoea stewartii subsp. stewartii; X., Xanthomonas; Colored boxes indicate the presence of a T3SS gene cluster within a genome. Each T3SS type is represented by different colors. Boxes with solid filled background indicate complete gene clusters, while boxes with light grid pattern indicate incomplete clusters. Green, yellow, red and blue boxes represent the presence of hrp/hrc1, hrp/hrc2, inv/mxi/spa and hrp/hrc3 gene clusters, respectively. The diagonal lines in the hrp/hrc3 group indicate its distinct lineage in the Rhc-II group. Two boxes in a column indicate the presence of two T3SS gene clusters.