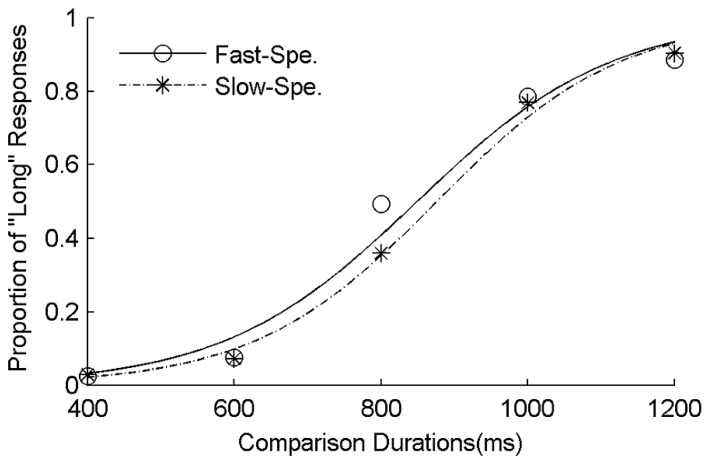
FIGURE 1.
Mean proportions of “Long” responses plotted against probe durations and fitted psychometric functions for the fast-speed words and slow-speed words conditions. The dashed curve and asterisks represented the slow-speed word condition, the solid curve and circles the fast-speed word condition.

