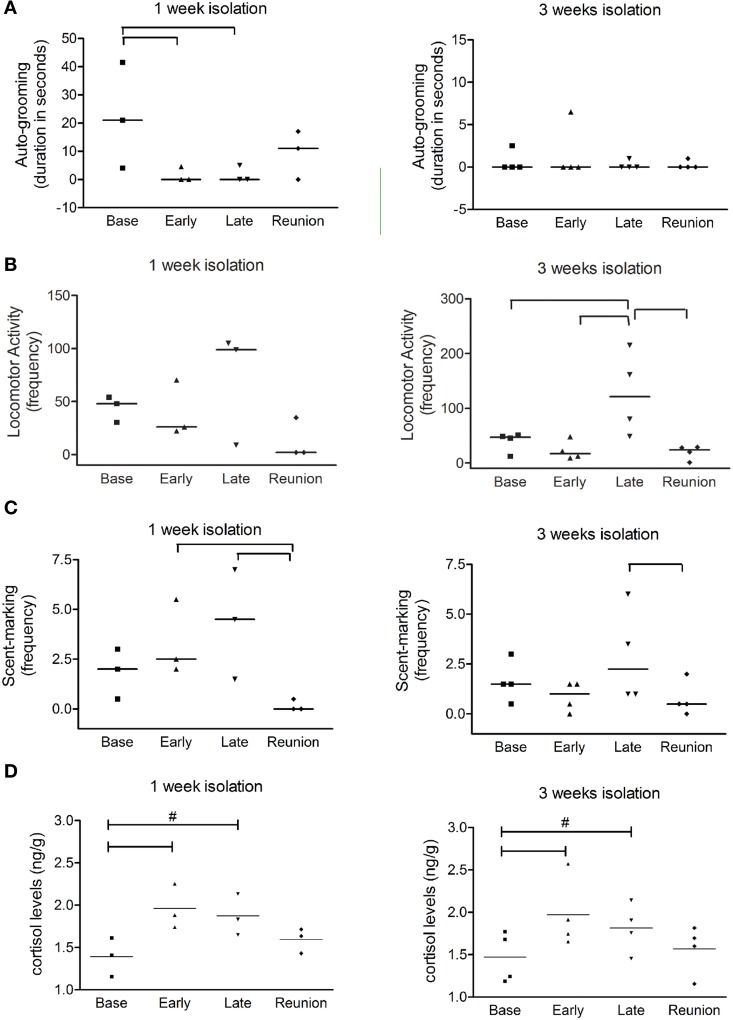
Figure 1.
Behavioral changes produced by isolation and cortisol measurement from fecal samples. Scatter plot graphs from behavioral observation data show (A) duration of auto-grooming (expressed in seconds); (B) frequencies of locomotor activity; and (C) frequencies of scent-marking during baseline phase (Base), two initial days of isolation (Early), two finals days of isolation (Late) and reunion for both 1 week and 3 weeks social isolation. In (D), scatter plots represent normalized cortisol levels for marmosets isolated during one and 3 weeks; Horizontal lines indicate median values; brackets designate significant alterations between phases (P < 0.05). # Indicate tendency of variation between respective phase and baseline phase (0.05 < P < 0.06).

