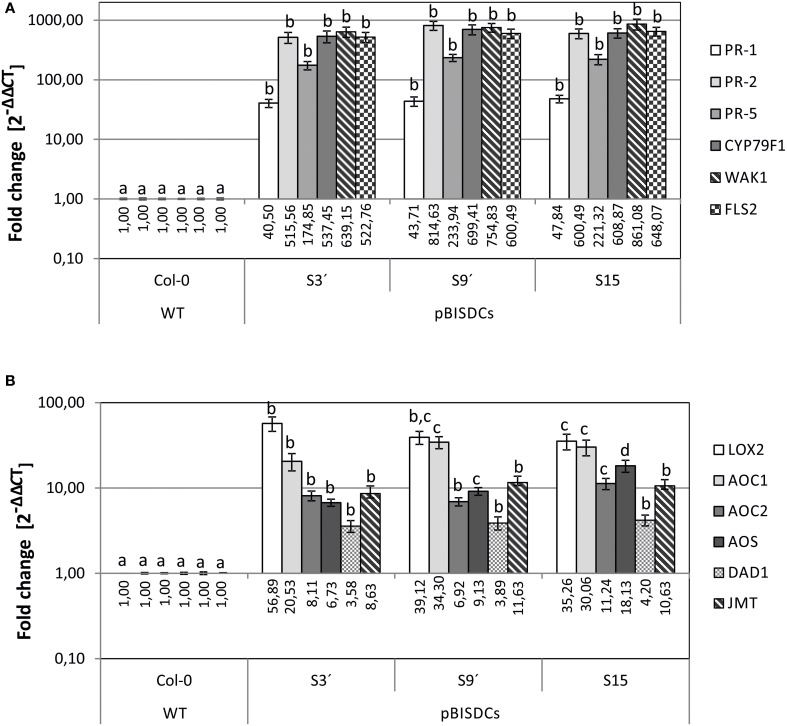
Figure 1.
qRT-PCR analysis of biotic stress-related genes in leaves of 4-week old A. thaliana WT and pBISDCs transgenic lines overexpressing SAMDC1 (S3', S9, and S15). Expression levels were determined for a set of biotic stress defense-related genes (A), as well as jasmonate and methyl-jasmonate biosynthesis genes (B). For each gene, data is expressed as fold change relative to the level measured in WT plants (2−ΔΔCT). Graph show the mean of three biological replicates ± standard deviation. Significant differences between plant lines are indicated with letters (ANOVA, Tukey HSD test, p < 0.05).

