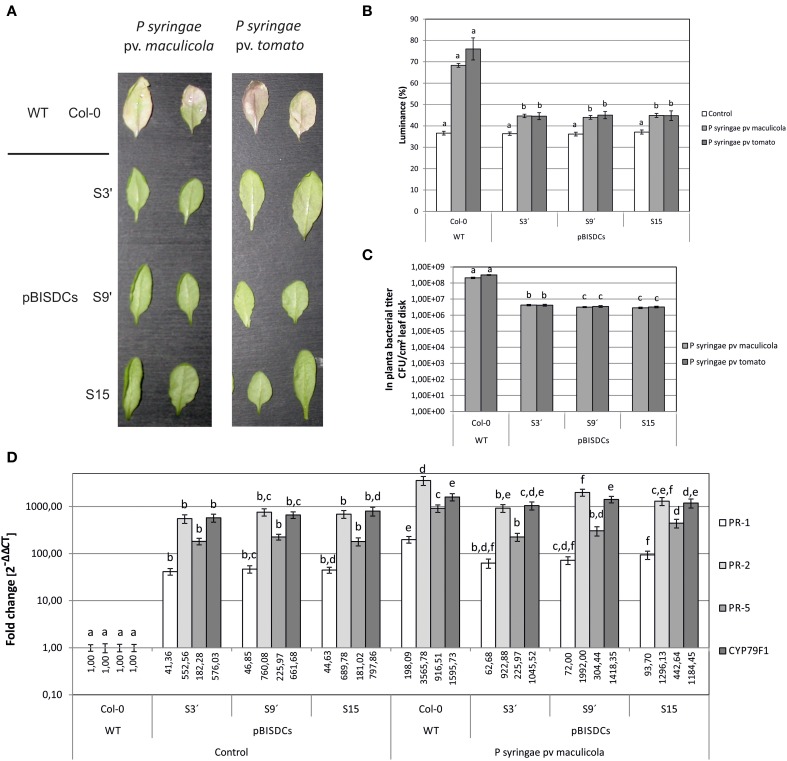
Figure 4.
Effects of P. syringae infection in Arabidopsis WT and pBISDCs transgenic lines overexpressing SAMDC1 (S3', S9, and S15). Leaves of 15 day-old plants were inoculated with a suspension of P. syringae strains pv. maculicola ES4326 or pv. tomato DC3000. Ten different plants for each line were inoculated. Disease extension was evaluated for each strain 3 days after inoculation visually (A), as well as by quantifying leaf luminance percentage by image analysis using the Image Processing Tool Kit 5.0 and Photoshop 7.0 softwares (B). Also, propagation of P. syringae in planta was estimated by determination of the number of CFU/cm2 of leaf disk (C). Ten different plants for each line were inoculated. Results show the mean ± standard deviation obtained for each combination of line and bacterial strain. For each condition, significant differences between lines are indicated with letters [ANOVA, Tukey HSD test (luminance data) or Dunnet's T3 test (CFU data), p < 0.05]. Plant response to P. syringae pv. maculicola infection was also studied by comparison of the expression levels for a set of biotic stress defense-related genes 3 days after inoculation with the bacterial strain or control inoculums (D). For each gene, data is expressed as fold change relative to the level measured in WT plants inoculated with control inoculum (2−ΔΔCT). Graph show the mean of three biological replicates ± standard deviation. Significant differences between plant lines are indicated with letters (ANOVA, Tukey HSD test, p < 0.05).

