Figure 6.
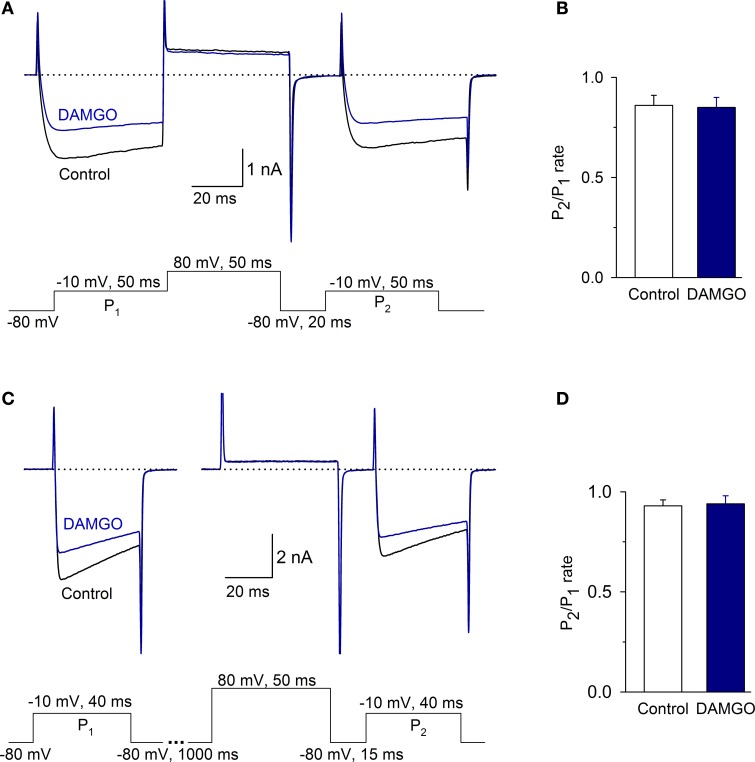
The voltage-dependent signaling mechanism did not participate in the inhibition of the ICa by MOR activation. (A,B) Traces of the ICa under the control condition and after 1 μM DAMGO perfusion. Protocols to evaluate the voltage-dependent modulation of the ICa consisted of two depolarizing pulses (P1 and P2, to −10 mV) separated by a depolarizing pulse that acted as a P2 prepulse (to 80 mV). (B) Bar graph showing the value of the P2/P1 ratio under control and after DAMGO. (C) The time between P1 and the pulse to 80 mV was 1 s to avoid inactivation accumulation. The ratio P2/P1 did not change between the control and after DAMGO application, independent of the time between P1 and the pulse to 80 mV. (D) Bar graph showing the value of the P2/P1 ratio under control and after DAMGO.

