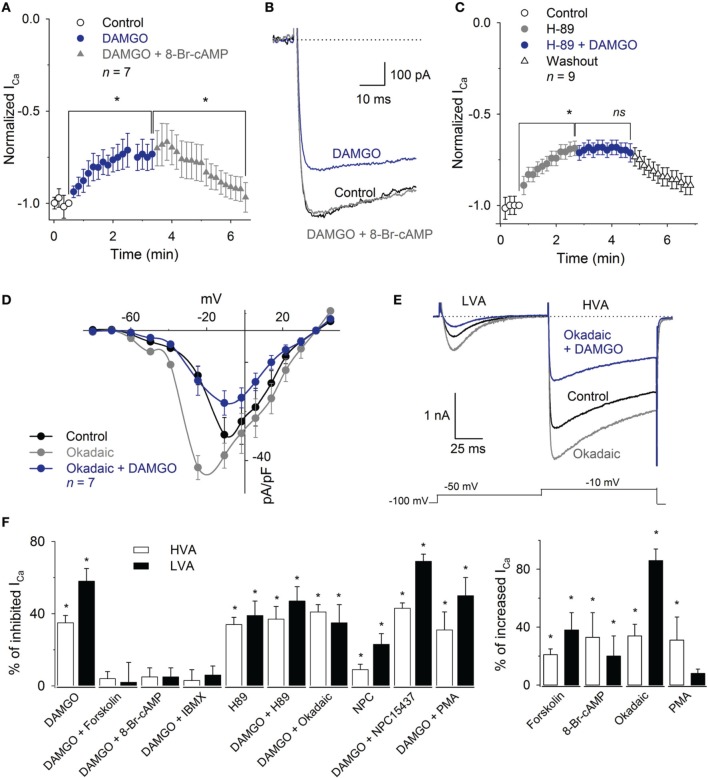
Figure 7.
Inhibition of the ICa by MOR activation was reverted by 8-Br-cAMP or IBMX and mimicked by H89. (A) Time course of the ICa amplitude under the control condition, after 1 μM DAMGO and DAMGO plus 1 mM 8-Br-cAMP application. The application of 8-Br-cAMP reverted the DAMGO inhibition 92 ± 7% (n = 7). (B) Traces of the ICa under the control condition, after DAMGO and after the co-application of DAMGO and 8-Br-cAMP. (C) Time course of the ICa peak amplitude under the control condition, after the use of 1 μM H89 and after 1 μM H89 plus 1 μM DAMGO perfusion. The H89 mimicked the inhibitory effect of DAMGO; the co-application of H89 and DAMGO did not add to its inhibitory effects (n = 9). (D) I-V relationship of calcium current showed that the phosphatase inhibition with 100 nM okadaic acid enhanced the HVA and LVA currents, shifted the peak of the IV relationship to less depolarized values, but was unable to occlude the inhibitory effect of 1 μM DAMGO. (E) Representative traces of the LVA and HVA currents in control, under perfusion with 100 nM okadaic acid and coapplication of 100 nM okadaic acid and 1 μM DAMGO. The okadaic acid enhanced the ICa but was unable to occlude the DAMGO effect. The line dotted line represents zero current. The voltage clamp protocol is shown below the recordings. (F) Bar graph summarizing the effects produced by the various drugs used to discern the pathways involved in MOR actions upon both the LVA and HVA current components (* means P < 0.05; ns means P > 0.05).

