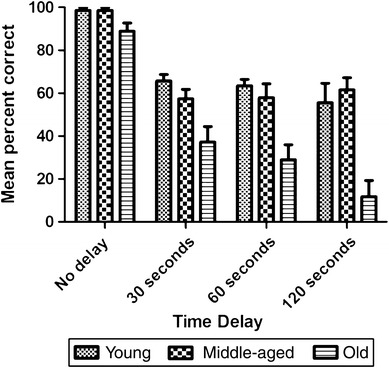
Fig. 1.

Mean percent of correct trials in the short-term memory test (STMT) as a function of age group and delay. Each data value is presented as a percent of the total number of trials. Error bars represent ± standard error of the mean (SEM)

Mean percent of correct trials in the short-term memory test (STMT) as a function of age group and delay. Each data value is presented as a percent of the total number of trials. Error bars represent ± standard error of the mean (SEM)