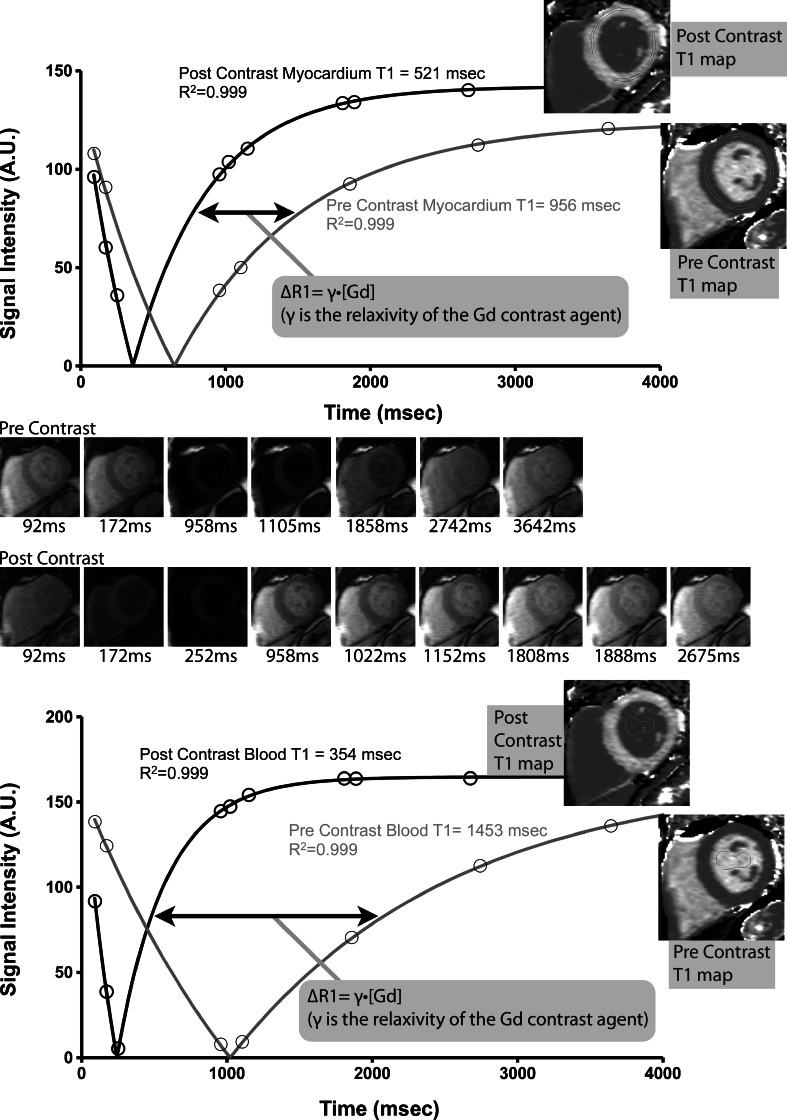
Fig. 1.
(Adapted from Wong et al [32], with permission from Lippincott Williams & Wilkins - Wolters Kluwer Health). Measurement of pre and postcontrast T1 in an individual with normal ECV. Short axis imaging at varying time points (precontrast images top row, postcontrast images bottom row) along with the corresponding fitting curves used to derive absolute T1 measurement. Calculations are performed at the pixel level to generate pre and postcontrast T1 maps

