Fig. 2.
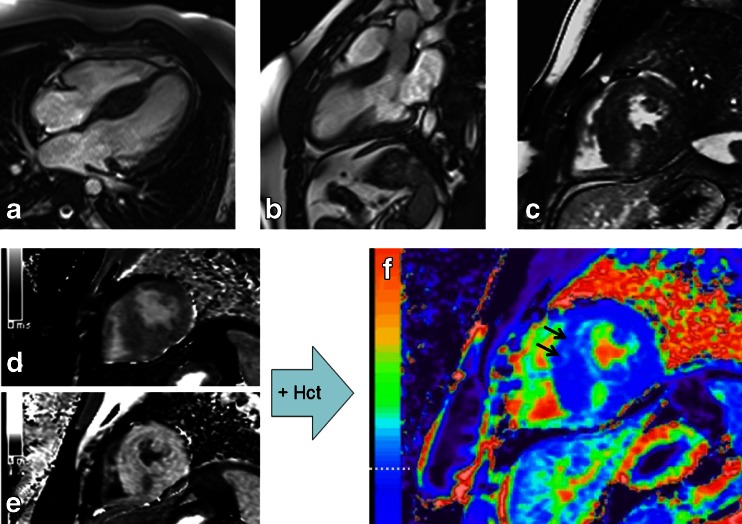
CMR images of a patient with hypertrophic cardiomyopathy. a Four-chamber steady state free precession (SSFP) image demonstrating asymmetric septal hypertrophy. b Three-chamber SSFP image. c Midventricular short axis LGE image ~15 minutes postgadolinium contrast showing focal LGE in the vicinity of the right ventricular insertion point. d Precontrast T1 map. e postcontrast T1map ~ 20 minutes postgadolinium contrast. f ECV map calculated using the T1 data and hematocrit. The horizontal dashed white line notes the color range of the upper limit of normal of ECV (~29.5 % at our center). The black arrows point to the anterior septal region where more diffuse fibrosis is identified, which was not as readily apparent on the LGE image (panel (c). Note: panels c, d, e, f are the same short axis slice

