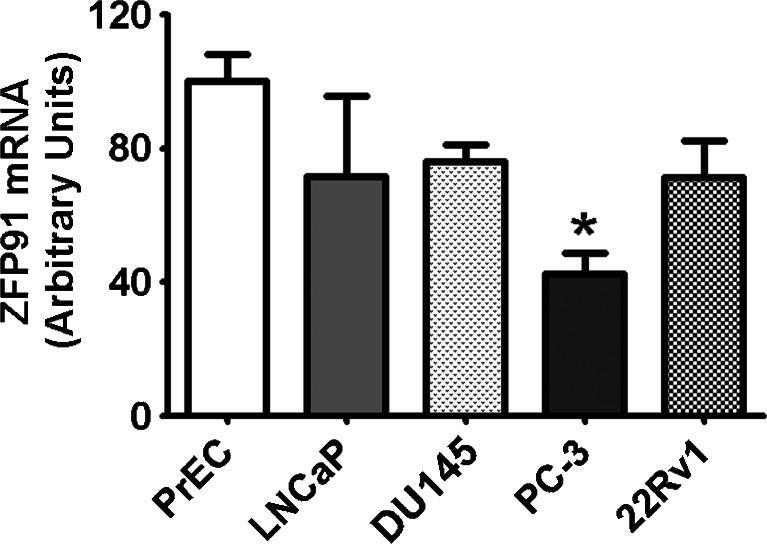
Fig. 4.
QPCR analyses of ZFP91 expression in cultured PrEC, LNCaP, DU145, PC-3 and 22Rv1 cells. Bars represent mRNA levels relative to reference genes. Mean expression in PrEC cells was assigned a value of 100 and normalized in other cell lines accordingly. Results are presented as means ± SD; each group n = 6. Statistical comparison by ANOVA followed by Tukey’s test; *p < 0.05

