
Figure 2.
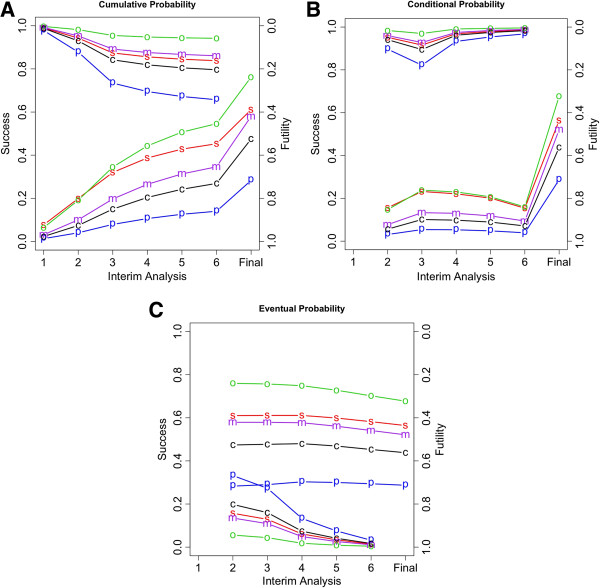
The symbols use in all panels refer to the prior weights indicated in Figure1,’ Abbreviations s, simple; p, pessimistic; o, optimistic; m, moderate; and c, custom. The top five lines and right y-axis show the futility results. The bottom five lines and the left y-axis show the success results. (A) Predictive probability of success or futility at or before the indicated interim analysis. (B) Probability of success or futility at the indicated interim analysis conditionally on ‘Continue’ at the previous interim analysis. (C) Predictive probability of eventual success or futility assuming ‘Continue’ at the previous interim analysis.