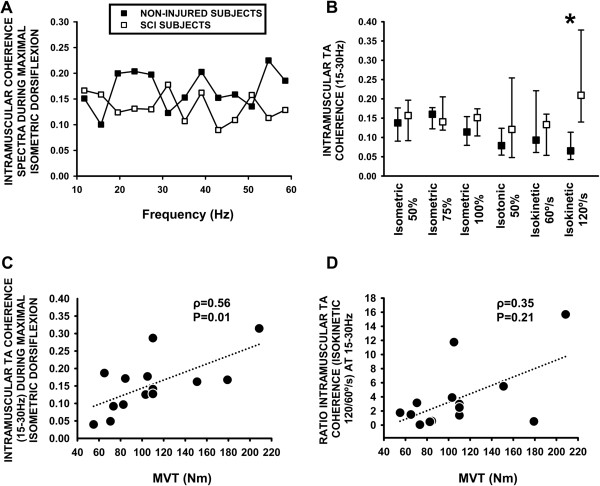
Figure 1.
Intramuscular TA coherence in the SCI group and in the non-injured group. A: Intramuscular TA coherence spectra (10-60 Hz) calculated during maximal isometric dorsiflexion in the SCI group (white symbols) and in the non-injured group (black symbols). B: Analysis of 15-30 Hz intramuscular TA coherence from healthy subjects and individuals with SCI during isometric, isotonic and isokinetic muscle activation. *: p ≤ 0.05. C: Correlation between intramuscular TA coherence calculated during isometric activation at 100% of MVT with maximal voluntary dorsiflexion torque. D: Correlation between velocity-dependent intramuscular TA coherence during 120/60°/s isokinetic activation with maximal voluntary dorsiflexion torque.

