
Figure 3.
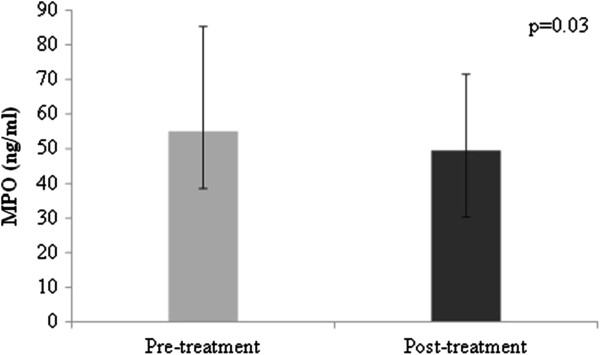
Myeloperoxidase levels (ng/ml) before and after treatment with fenofibrate. Bars represent median values; error bars represent quartile 1 and quartile 3 MPO, myeloperoxidase.
Official websites use .gov
A
.gov website belongs to an official
government organization in the United States.
Secure .gov websites use HTTPS
A lock (
) or https:// means you've safely
connected to the .gov website. Share sensitive
information only on official, secure websites.
Myeloperoxidase levels (ng/ml) before and after treatment with fenofibrate. Bars represent median values; error bars represent quartile 1 and quartile 3 MPO, myeloperoxidase.