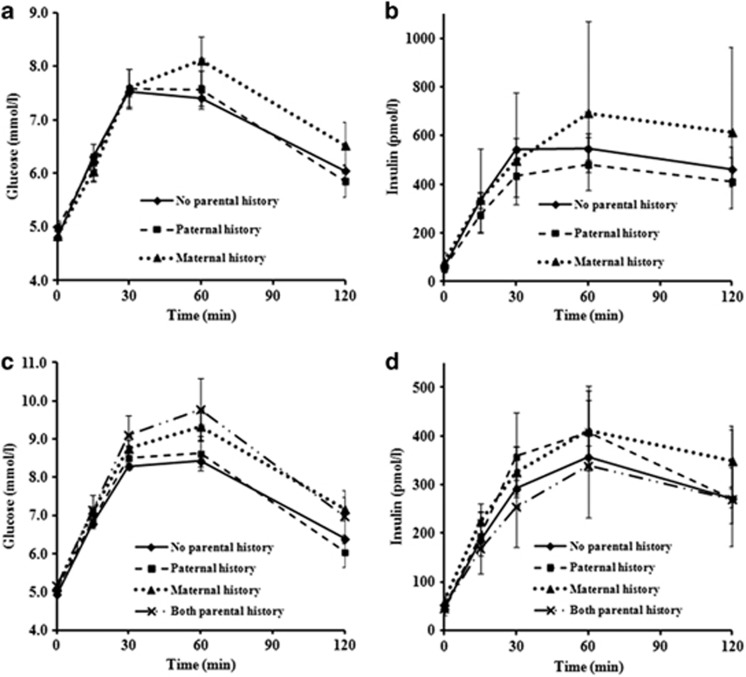
Figure 2.
Plasma glucose and insulin concentrations at 0, 15, 30, 60 and 120 min during oral glucose tolerance test (OGTT) in (a, b) adolescents (n=279) and (c, d) adults (n=555) according to parental history categories of diabetes. Data were expressed as mean±s.e. Associations between glucose/insulin concentrations and parental history categories for each time point during OGTT were shown in Supplementary Table 2.

