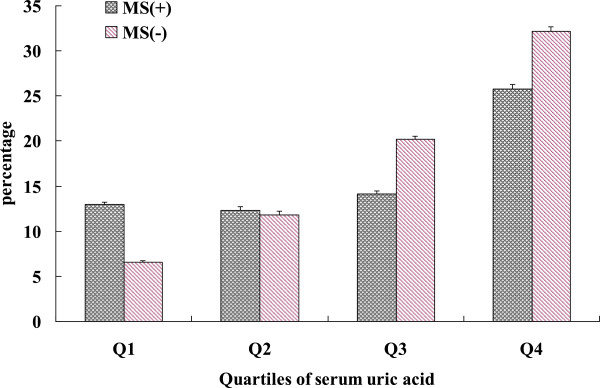
Figure 2.

Prevalence of CVD according to quartiles of uric acid and the presence of metabolic syndrome (adjusted for age, gender, alcohol drinking, smoking, education, physical activity, TC, LDL). Data are expressed as percentages ± SE. P < 0.001 for trend in MS(−) group, and p = 0.217 for trend in MS(+) group.
