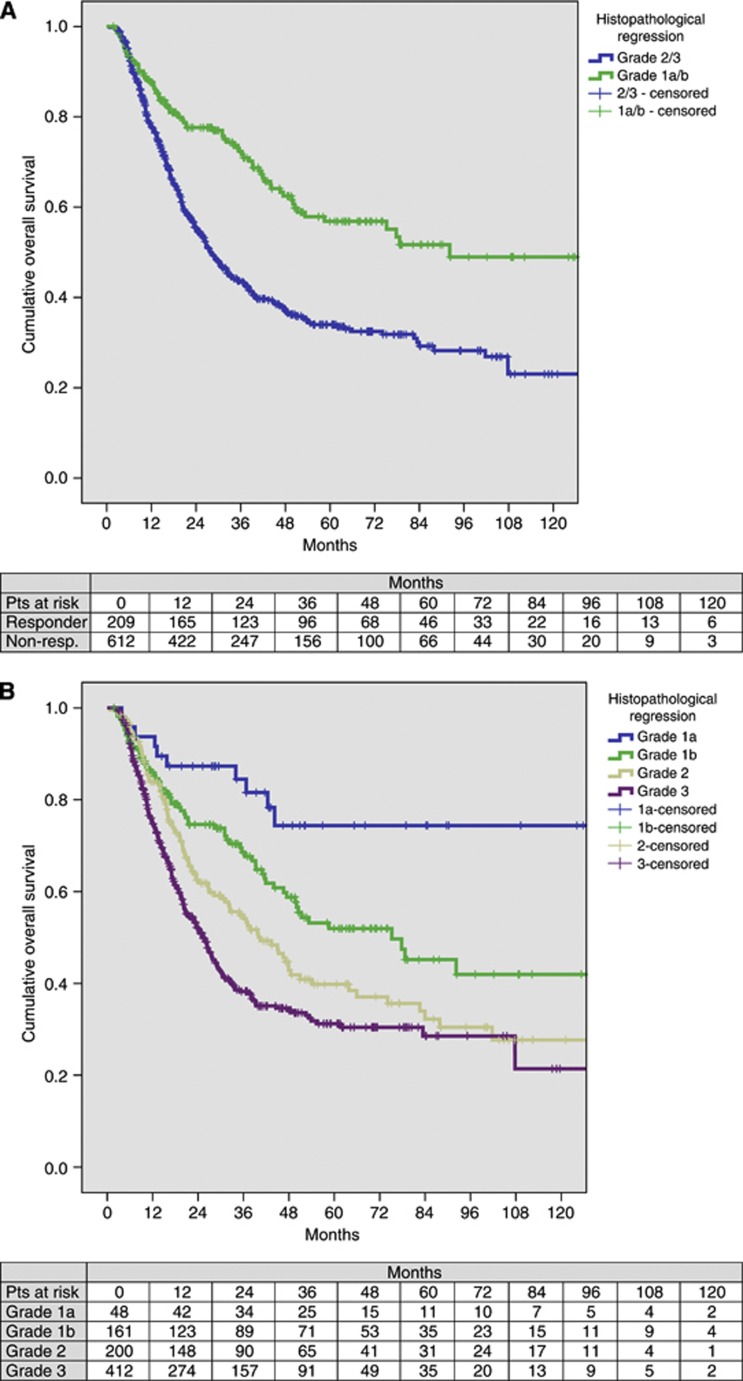
Figure 2.
Prognostic value of the histopathological regression. Kaplan–Meier plots for overall survival of (A) histopathological regression grading grouped grade 1a/b and group 2/3 and (B) histopathological regression by subgrades (n=850, P<0.001). The tables show the number of patients at risk at the indicated time points.

