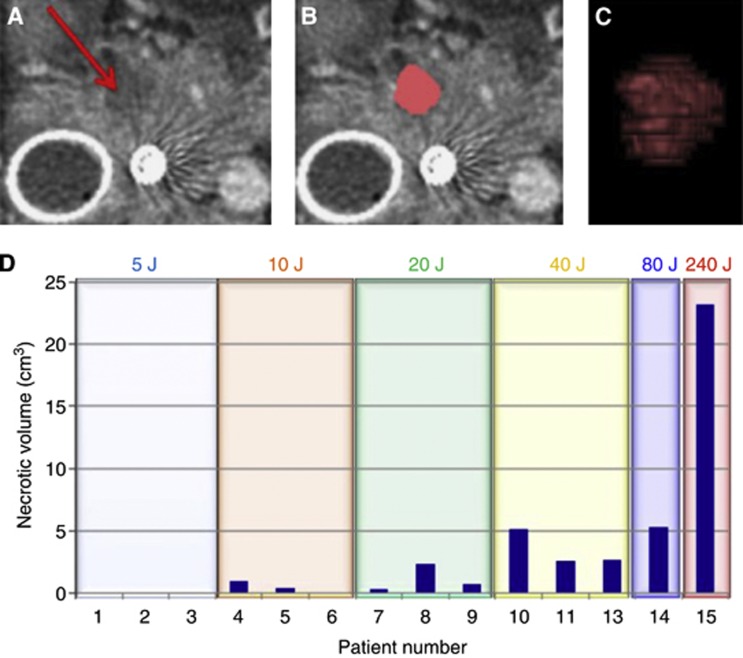
Figure 2.
Necrosis measurements following verteporfin PDT in patient 4. (A) A single axial slice of the pancreas from the post-treatment CT scans. The arrow indicates the area of necrosis within the pancreas. (B) The same slice showing segmentation of the necrotic tissue in pink. (C) Volume rendering of segmentation of the necrotic zone. (D) The volume of the necrotic tissue region is shown for each patient in the study, as determined from the segmentation of the post-treatment CT scans. Total energy delivered is shown for each patient. For patient 14, two fibres of 1-cm diffuser length each delivering 40 J cm−1 were used. For patient 15, three fibres of 2-cm diffuser length each delivering 40 J cm−1 were used. Patient 12 is not included in this figure as necrosis was present before treatment and therefore the effect of treatment could not be assessed.

