
Figure 4.
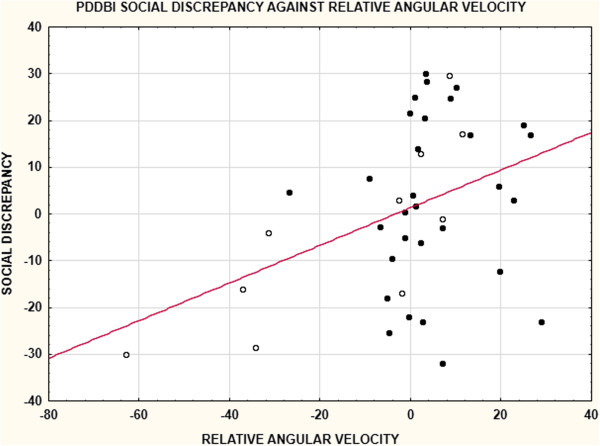
This figure shows the relation between the PDDBI Social Discrepancy score and relative angular velocity. ASD cases are in filled circles and Not-ASD cases in open circles. The regression function is for the entire sample. Note that relative angular velocity has more variation in the Not-ASD group than in the ASD group accounting for the stronger correlation for the Not-ASD group in Table 5.