
Figure 5.
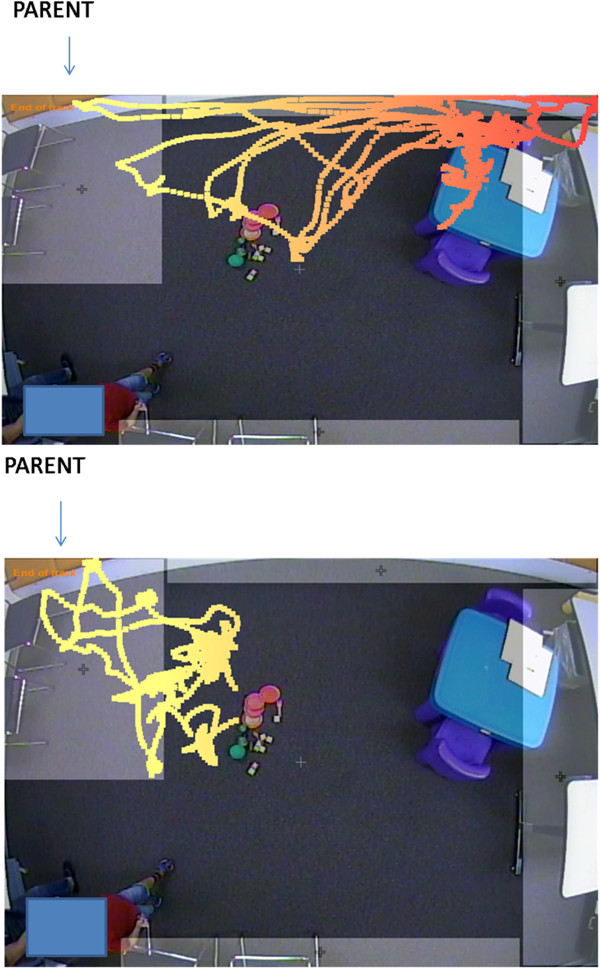
Paths taken in the first of two 3-min intervals prior to ADOS-G assessment in two 2-year-old boys. Color indicates distance from parent ROI (yellow is closer). Child on top has ASD, child on bottom has a language delay.
Official websites use .gov
A
.gov website belongs to an official
government organization in the United States.
Secure .gov websites use HTTPS
A lock (
) or https:// means you've safely
connected to the .gov website. Share sensitive
information only on official, secure websites.
Paths taken in the first of two 3-min intervals prior to ADOS-G assessment in two 2-year-old boys. Color indicates distance from parent ROI (yellow is closer). Child on top has ASD, child on bottom has a language delay.