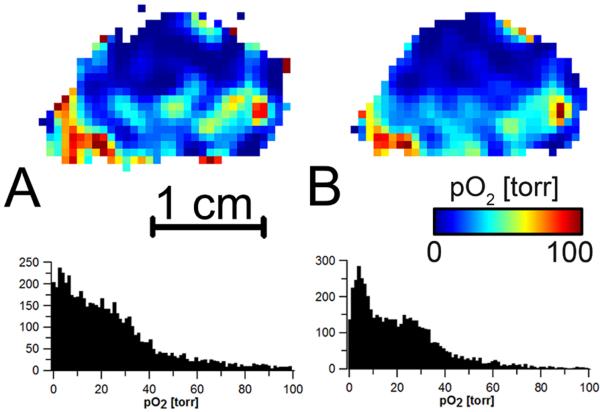
FIGURE 5.
A selected slice from three dimensional oxygen images in a mouse leg bearing tumor obtained using AG/LGR. Images are reconstructed from the same dataset A. with baseline correction; and B without baseline correction. The histograms below each slice show the distribution of oxygen in the volume of the images.

