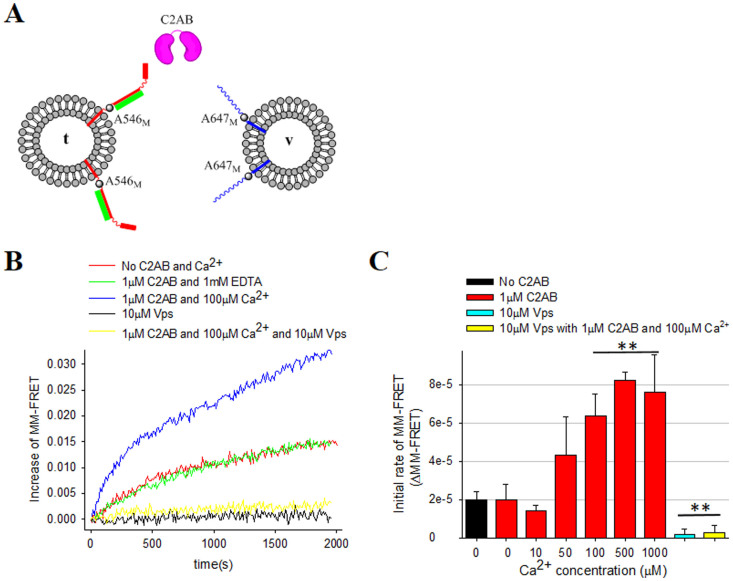
Figure 2. Ca2+-dependent stimulation of SNARE zippering by C2AB.
(A)The schematic diagram for the MM-FRET assay. SyxF Y257C-A546 (red) combined with SNAP-25 (green) are reconstituted to t-vesicles, while VAMP2 K87C-A647 (blue) was reconstituted to v-vesicles. C2AB is shown in pink. (B) Changes of the FRET signal in time after mixing t- and v-vesicles are shown. The red line is the control with labeled SNAREs only without C2AB or Ca2+. The green line represents FRET signal with 1 μM C2AB and 1 mM EDTA, while the blue line represents FRET signal with 1 μM C2AB and 100 μM Ca2+. The yellow line represents FRET signal with 1 μM C2AB, 100 μM Ca2+ and 10 μM Vps. The black line is with 10 μM Vps without C2AB and Ca2+. (C) Initial rate of FRET signal in the MM-FRET assays at different Ca2+ concentrations. The error bars, which represent standard deviation, were obtained from 3 independent measurements from 3 different preparations (*P < 0.05, **P < 0.01, and n.s means not significant).

