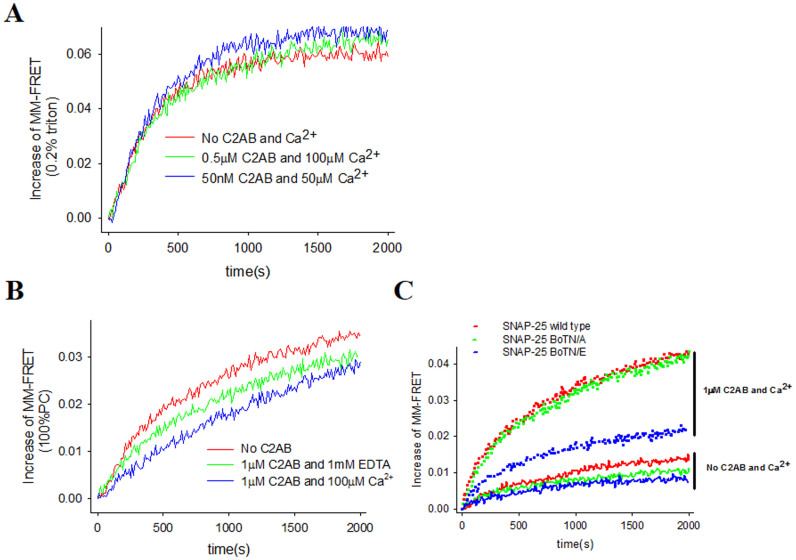
Figure 4. C2AB-Ca2+ stimulates SNAREpin formation via crosslink two opposition membranes.
(A) MM-FRET in presence of 0.8% OG. The red line is the control with labeled SNAREs only without C2AB or Ca2+. The green line represents FRET signal with 0.5 μM C2AB and 100 μM Ca2+, while the blue line represents signal with 0.05 μM C2AB and 50 μM Ca2+. (B) The MM-FRET with neutral membrane. The red line is the control with labeled SNAREs only without C2AB or Ca2+. The green line represents signal with 1 μM C2AB and 1 mM EDTA, while the blue line represents signal with 1 μM C2AB and 100 μM Ca2+. (C) MM-FRET with SNAP-25 BoNT/A and BoNT/E. The dotted lines represent MM-FRET with C2AB with Ca2+, while the sold lines represent MM-FRET with C2AB only. And the red line is the control with labeled SNAREs with WT SNAP25. The green line is with SNAP25 BoNT/A, while the blue line is with SNAP25 BoNT/E.

