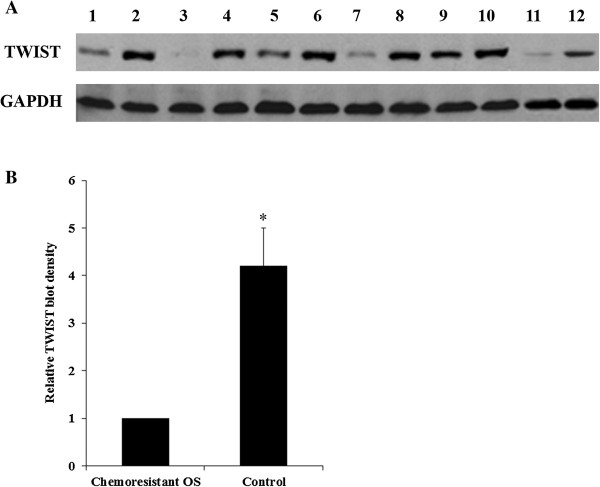
Figure 1.
Western blot analysis of TWIST expression in chemoresistant and control osteosarcoma (OS) tissues. (A) OS tissue lysates from the chemoresistant OS and the non-chemoresistant control groups (n = 6 each) were subject to western blot analysis for TWIST expression. Glyceraldehyde-3-phosphate dehydrogenase (GAPDH) blotting was used as a loading control. Lanes 1, 3, 5, 7, 9, 11 were samples from the chemoresistant OS group. Lanes 2, 4, 6, 8, 10, 12 were samples from the control group. (B) Density of the TWIST blots was normalized against that of GAPDH to obtain a relative blot density. The relative TWIST blot density of the non-chemoresistant control group was expressed as fold changes to that of the chemoresistant OS group (designated as 1). *p < 0.05 vs chemoresistant OS.

