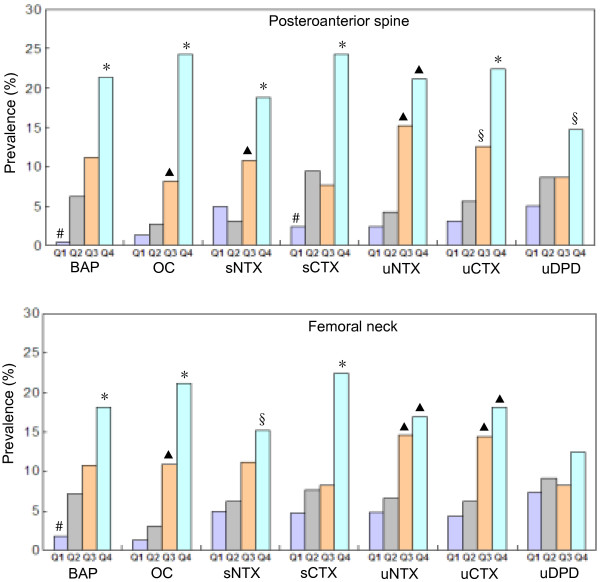
Figure 2.
Comparison of prevalence of osteoporosis diagnosed using BMD T-scores at different skeletal sites in native Chinese women, by quartiles of bone turnover markers. Abbreviations: as in Figure 1. *P = 0.037–0.000 compared with Q1, Q2 and Q3. ▲P = 0.035–0.000 compared with Q1 and Q2. #P = 0.048–0.000 compared with Q2 and Q3. §P = 0.024–0.001 compared with Q1.

