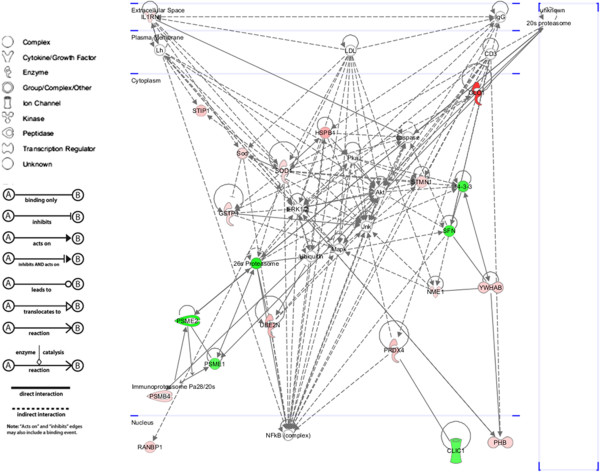
Figure 2.

Top-scored molecular network with identified proteins implicated in cancer progression according to the IPA software. Proteins in the network are represented by their gene symbols. Green colored shapes denote proteins with lower abundance in oral cancer cell lines, while red colored shapes denote proteins with higher abundance in oral cancer cell lines A) molecule types, B) relationship types.
