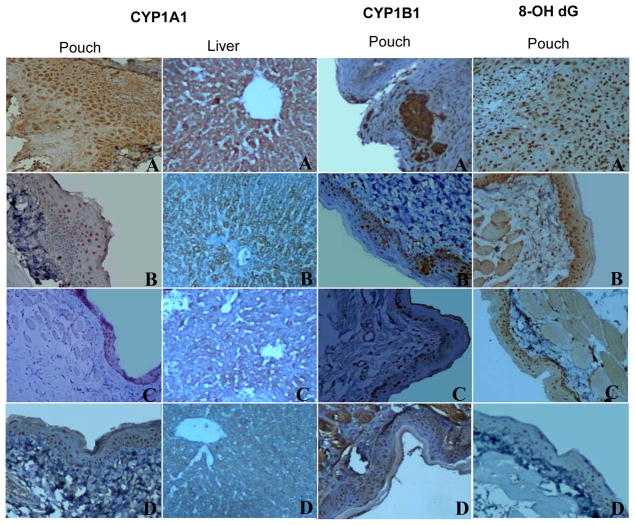
Figure 1. Photomicrographs of immunohistochemical staining of CYP1A1, 1B1 and 8-OH-dG expression in the buccal pouch and liver of control and experimental animals (20X).
A Overexpression of CYP1A1, 1B1 and 8-OH-dG in the pouch and liver tissues of DMBA treated animals (group 1)
B, C Downregulation of CYP1A1, B1 and 8-OH-dG in the pouch and liver tissues of DMBA+P-B and DMBA+BTF-35 treated animals (groups 2 and 3 respectively)
D Normal expression of CYP1A1, B1 and 8-OH-dG in the pouch and liver tissues of animals administered P-B and BTF-35 alone and control animals (Groups 4, 5 and 6 respectively)

