
Fig. 4.
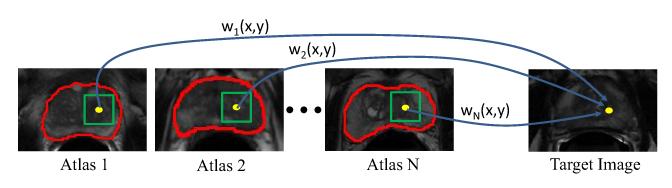
The schematic illustration of multi-atlases label propagation. In this example, N atlases with their segmentation groundtruths highlighted by red contours are available. For the reference voxel highlighted by the yellow dot in the target image, its prostate likelihood can be estimated by comparing its feature signature with those of the neighboring candidate voxels within the green squares in the atlases. The contribution of each candidate voxel y in the ith atlas during label propagation is determined by the graph weight wi(x, y).