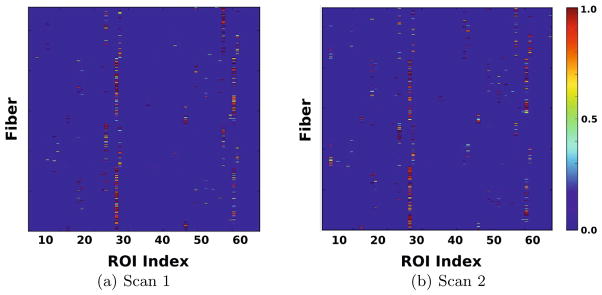
Fig. 2.

Connectivity signatures of Corpus Callosum corresponding to different scans of a subject. The x-axis represents ROI index. Each row corresponds to connectivity signature
 of a fiber. Colors indicate the connection probabilities to ROIs. Note, the common patterns of connections even though the scans are not registered or fibers are not ordered.
