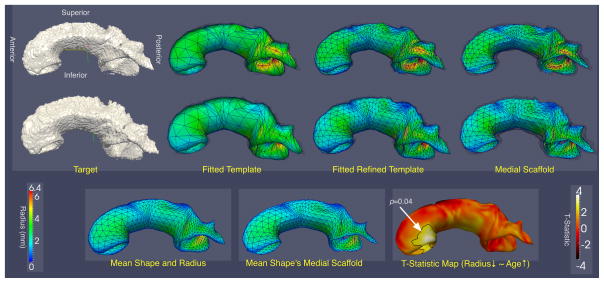
Fig. 3.
Results from CC fitting experiment. The top two rows show two examples (third-worst and third-best fitting quality) of templates fitted to atlas-based CC segmentations. The columns show the target surface, the template fitted using ICP, the last-stage fitted subdivided template, and the medial scaffold of the latter. The bottom row shows the Procrustes mean of the fitted models, its medial scaffold (computed by applying ICP-style fitting to the Procrustes mean), and the t-statistic map for the age-related thinning hypothesis. The significant cluster (p = 0.04) is outlined.

