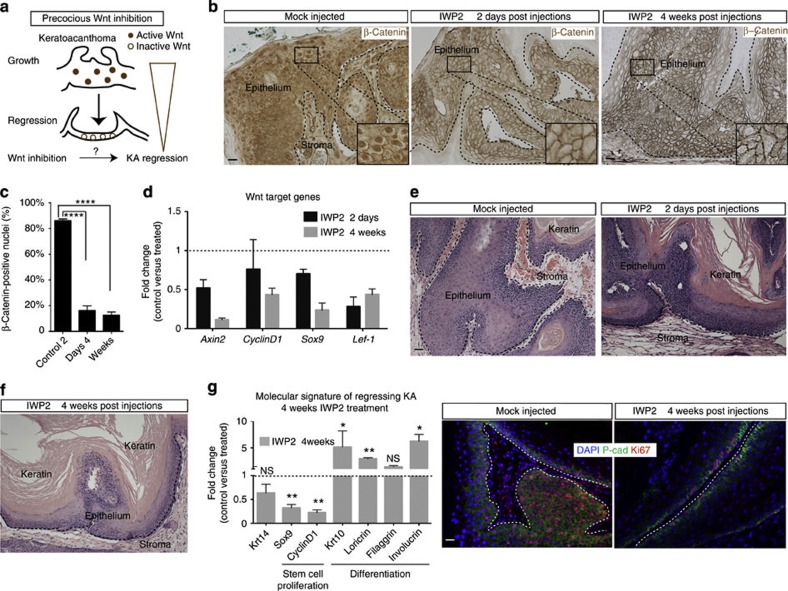
Figure 4. Wnt inhibition is sufficient to induce KA regression.
(a) Schematic model for Wnt inhibition as trigger for KA regression. (b,c) β-Catenin immunohistochemistry on IWP2-treated tumours versus mock-injected tumours (scale bar, 50 μm). Nuclear β-catenin quantification of the number of nuclear β-catenin+ cells at the 2 days and 4 weeks time points of IWP2-treated tumours (83%±2 versus 17%±3 and 15%±2, respectively). Data are represented as mean±s.d. (n=4) (****<0.001 obtained by unpaired t-test statistical analysis) (scale bar, 50 μm). (d) qRT–PCR analysis on IWP2- versus mock-injected KA tumours of Wnt target genes at both 2 days and 4 weeks post injections. Dotted line represents the normalized expression level of each transcript analysed during tumour growth. Data are represented as mean±s.d. (n=4). (e) Hematoxylin and eosin staining performed on IWP2 and PBS-injected tumours at 2 days and 4 weeks post injections (scale bar, 50 μm). (f) qRT–PCR for proliferation and terminal differentiation markers in IWP2-injected KAs. Dotted line represents the normalized expression level of each gene analysed during tumour growth. Data are represented as mean±s.d. (n=4) (**<0.005, *<0.01, obtained by unpaired t-test statistical analysis). (g) Ki67 (red) and P-cadherin (green) immunofluorescence staining on IWP2- and mock-injected tumours. DAPI (blue) labels all the nuclei (scale bar, 50 μm). Dotted lines delineate the tumour/stroma interface.

