Fig. 1.
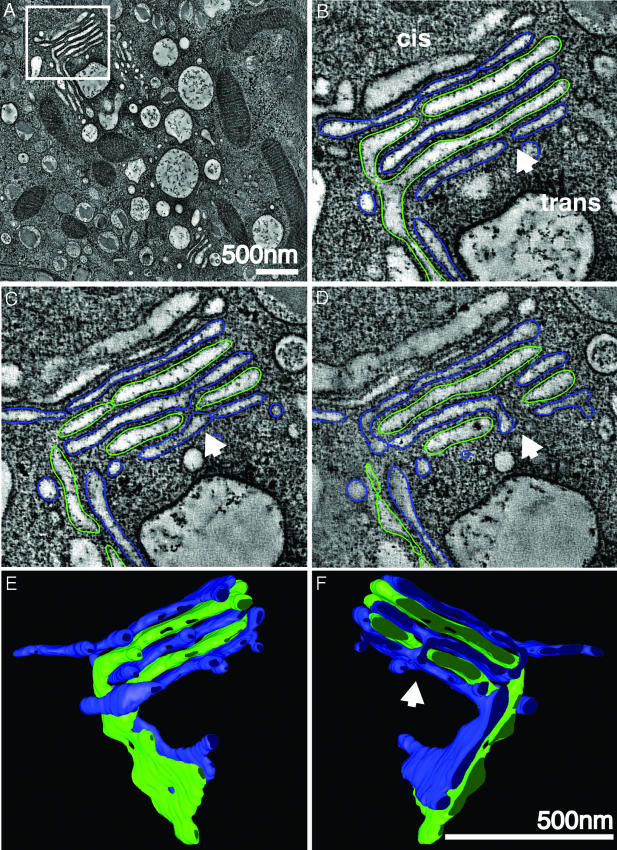
Cisternal bypass in the Golgi of glucose-stimulated islet beta cells. (A) Low magnification overview of the Golgi ribbon in a pancreatic beta cell preserved in situ in an isolated mouse islet stimulated with 11 mM glucose for 1 h. The box highlights a branched region of the ribbon shown at higher magnification in B, C, and D. Each panel represents individual (sequential but not adjacent) tomographic slices (z = 2, 9, and 21) extracted from the 103 tomographic slices (each 2.3 nm thick) that together comprise the reconstructed 3D volume. (B) The apparent trans-most cisterna (blue) and the penultimate trans-cisterna (green) stay in register where the Golgi ribbon branches. However, all cisternae in the upper stack are not directly continuous across the branch point with cisternae at equivalent levels in the lower stack. Direct continuity between alternating, nonequivalent cisternae (green) occurs laterally at the periphery of a cisternal opening (A and B). Alternate cisternae (blue) connect directly with each other through an opening or fenestration in the interceding green cisterna (arrowhead). This process is not readily apparent in a single tomographic slice and is thus displayed in two sequential slices that are ≈28 nm apart in the z axis (C and D). (E and F) Front and back views (rotated 180°) of the 3D model generated by manually segmenting (“modeling”) the tomographic data represented in A–D. Both types of cisternal bypass can be seen. In E and F, the lateral continuities at the periphery of the upper stack can be followed; the arrowhead in F highlights the connection between cisternae at different levels (blue) through a fenestration or hole in the adjacent (green) cisterna. Movies 1 and 2 that show the original tomographic data (Movie 1), together with the modeled data derived from the 3D reconstructions (Movie 2), allow one to better follow and appreciate these connections. (Scale bars, 500 nm.)

