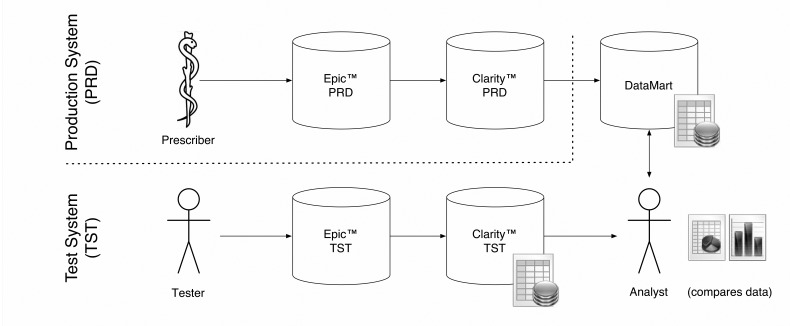
Fig. 3.
Swim lane diagram of the CPOE dosing rules evaluation system. The top lane represents the production system and its data warehouse, which provides data to the study data mart. The lower lane represents the test system. The data analyst interprets output from both the data mart and the test system after running medication-dosing scenarios.

