Fig. 5.
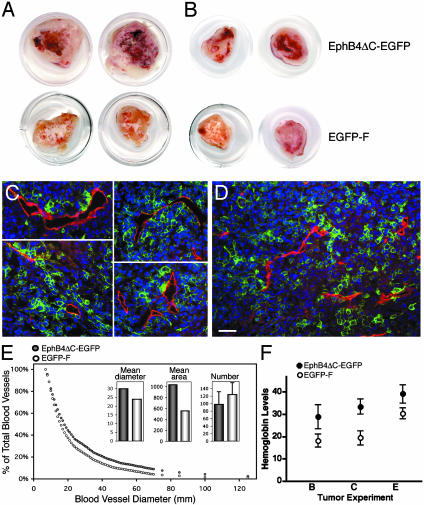
Effects of EphB4ΔC-EGFP and EGFP-F on tumor vascularization. (A and B) Tumors expressing EphB4ΔC-EGFP or EGFP-F from the experiment shown in Fig. 4A (A) and B (B). (C and D) Fluorescent images of frozen sections from EphB4ΔC-EGFP (C) or EGFP-F (D) tumors stained for CD-31 (red). Green fluorescent tumor cells are in close contact with red endothelial cells (overlap shown in yellow). (Scale bar represents 50 μm.) (E) Distribution of blood vessels with diameters larger than indicated on the abscissa. Blood vessels from EphB4ΔC-EGFP tumors are larger that those from EGFP-F tumors (P < 0.01, by Kolmogorov–Smirnov test). Mean diameter sizes (30 μm versus 24 μm, P < 0.0001 by t test), mean area sizes (1,037 μm2 versus 559 μm2; P < 0.0001 by t test), and mean numbers of blood vessels per photograph ± SD (98 ± 34 versus 124 ± 32, P < 0.01 by t test) are shown in Insets. (F) Increased hemoglobin concentration in EphB4ΔC-EGFP tumors compared with EGFP-F tumors. Means for the experiments shown in Fig. 4 B, C, and E ± SEM are shown. P < 0.002 by two-way ANOVA.

