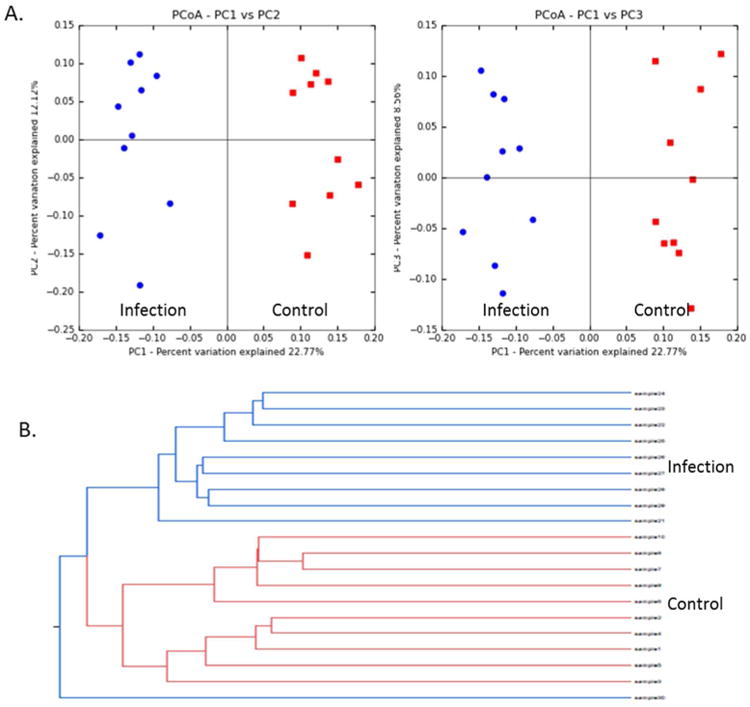
Figure 4.

The gut microbiome patterns of control samples (Red) and infected (Blue) mice are readily differentiated by Principal Coordinate Analysis (PCoA), with 22.8%, 12.1% and 8.6% variation explained by PC1, PC2 and PC3, respectively (A); Hierarchical Clustering analysis by Unweighted Pair Group Method with Arithmetic mean indicates that controls and infected mice cluster in their own groups (Red for control, Blue for treatment group) (B).
