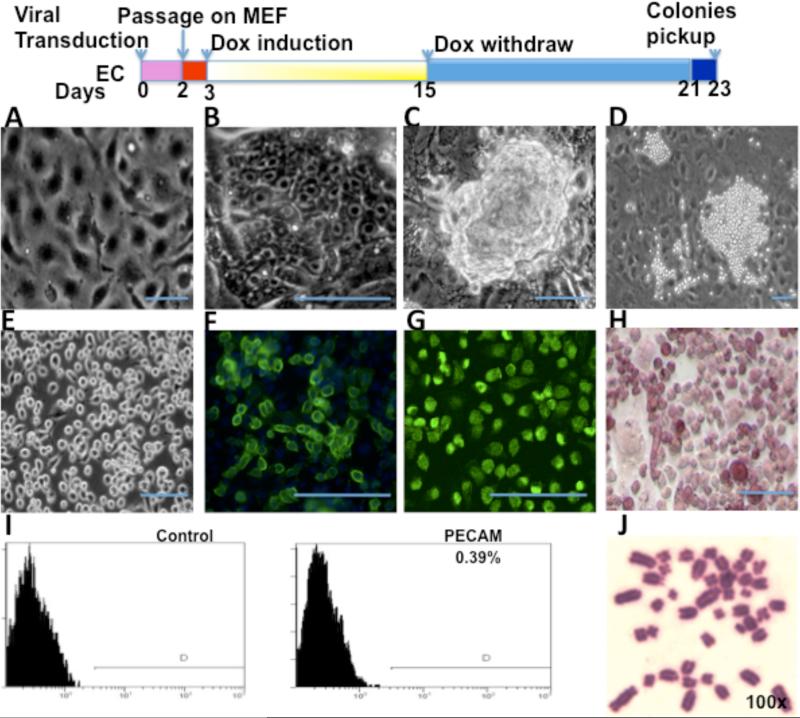
Figure 1.
Generation of iVPCs from rat ECs transduced with transcription factors OKSM. Top panel is the schematic diagram of the protocol for reprogramming. (A) Confluent rat EC morphology before reprogramming. After transduction ECs showed ES-like morphology at day 4 (B), formed ES-like colonies at day 14 and retained the morphology until 16 days (C), and changed to ball-like iVPCs at day 21 (D). Most iVPCs retained stable morphology during expansion (E). iVPCs expressed ES cell marker SSEA-1 (F),Oct4 (G), Alkaline Phosphatase (H) by immunostaining. iVPCs showed only 0.39% EC marker PECAM by FACS analysis (I). iVPCs at passage 16 showed a normal 42xy Karyotype (J). Scale bar equals 100μm.

