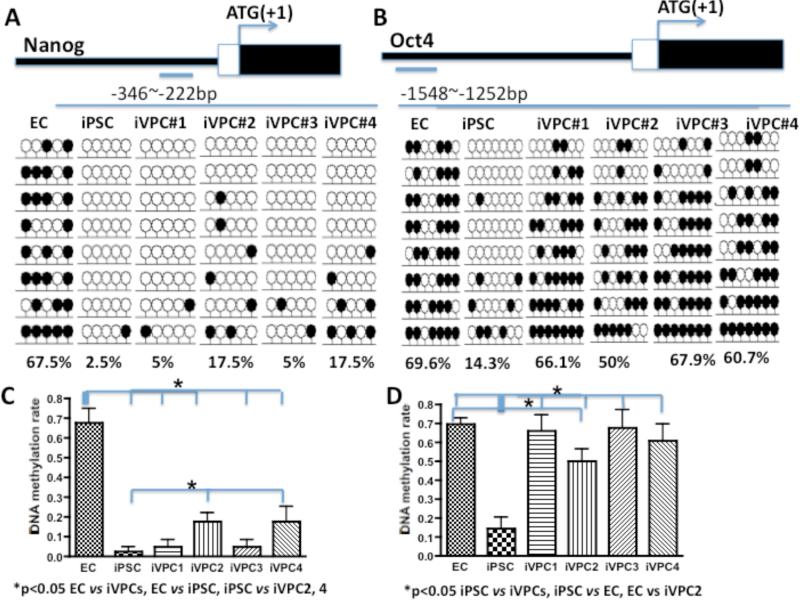
Figure 3.
DNA methylation status (bisulfite sequencing) of the Nanog (A) and Oct4 (B) promoter regions of endothelial cells (ECs), iPSCs from fully reprogrammed fibroblasts, and 4 randomly selected clones of induced vascular progenitor cells (iVPCs). Open and closed lollipops indicate unmethylated and methylated CpGs, respectively. The top panel shows the promoter region of Nanog and Oct4 relative to the translation start site. The bottom numbers indicate the methylation percentage of CpG in the region. C and D show the statistical summary for A and B.

