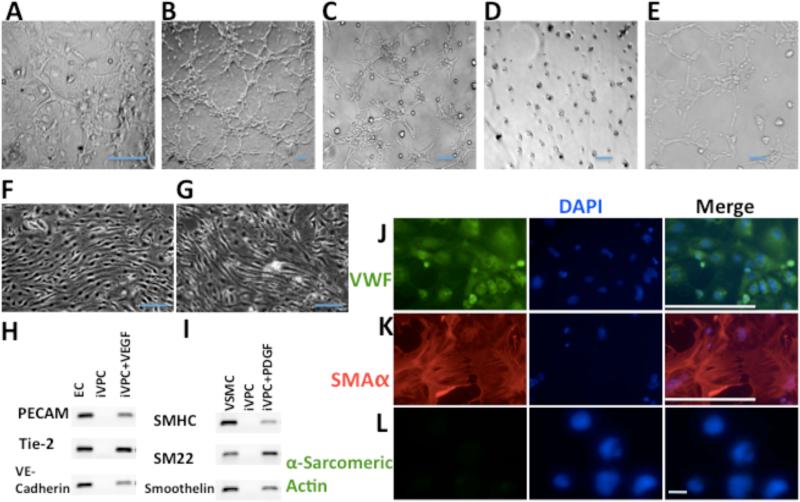
Figure 4.
Angiogenic potential of iVPCs. (A) iVPCs spontaneously formed a “tube”-like network on feeder cells. In GFR Matrigel, ECs (B) and iVPCs (C) formed tube-like network in medium with serum and VEGF (50ng/mL). In the absence of serum and VEGF, ECs did not form tubes in the GFR Matrigel (D). In contrast, iVPCs formed an extensive tube-like network under same conditions (E). When exposed to shear stress for 72 hr, ECs (F) and differentiated iVPCs (G) aligned parallel to shear stress. iVPCs could differentiate into ECs with induction of VEGF (50ng/mL) shown in RT-PCR analysis (H) and immunostained with the EC marker VWF (J, with VWF stained in green and DAPI stained in blue. iVPCs could differentiate into VSMCs with induction of PDGF (50ng/mL) shown in RT-PCR analysis (I) and immunostained with the VSMC marker α-SMA (K, α-SMA stained in red and DAPI stained in blue). But iVPCs could not differentiate into cardiomyocytes either with BMP4 (10ng/mL), Activin A (10ng/mL) and bFGF (10ng/mL) or with 3 μM 5-azacytidine shown by negative staining of α-Sarcomeric Actin (L). Scale bar equals 100μm in A-J, and scale bar in L equals to 10μm.

