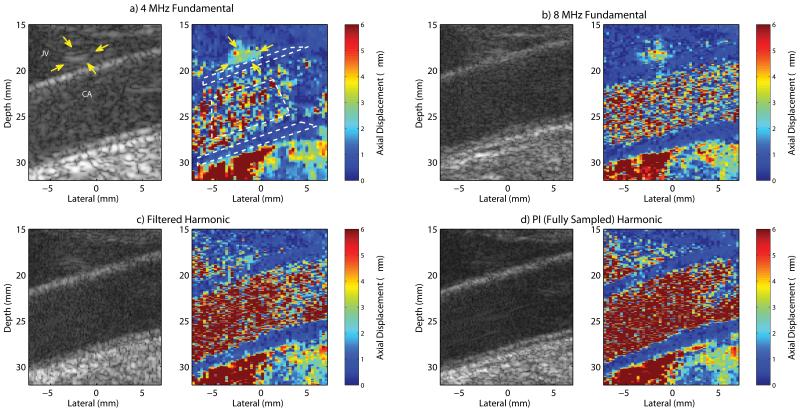
Fig. 4.
In vivo a) 4 MHz fundamental, b) 8 MHz fundamental, c) filtered harmonic, and d) fully sampled pulse inversion (PI) harmonic B-mode and ARFI images of a carotid artery (CA) and jugular vein (JV) in a healthy, normal subject. Yellow arrows in the 4 MHz fundamental images indicate a spatially-matched region of increased B-mode amplitude and increased ARFI displacement within the jugular vein near the proximal wall. The white-dashed contours in the 4 MHz fundamental ARFI image indicate the regions corresponding to the measured displacements and normalized cross-correlation values listed in Table I.

