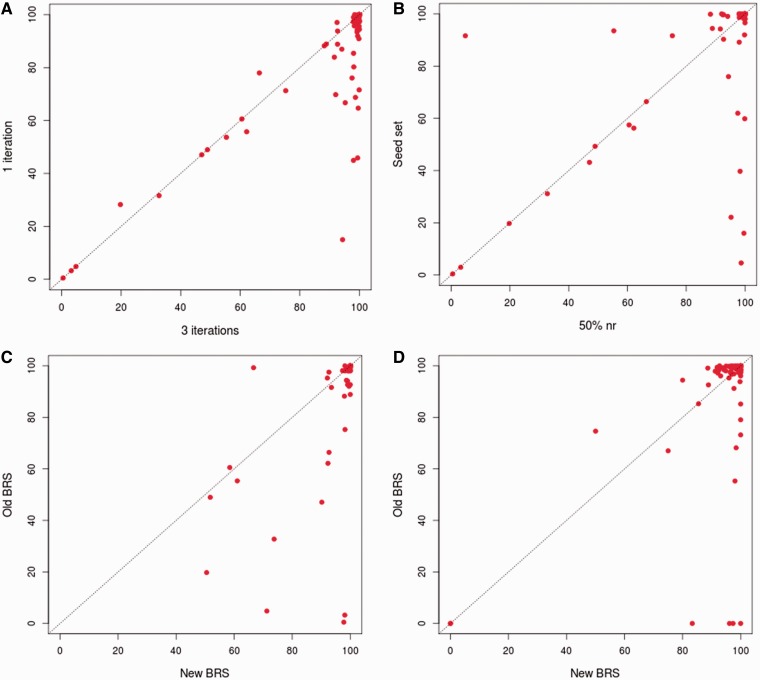
Figure 2.
Comparison of representative coverage in a family. (A) Comparison of coverage obtained where the representative family profile is generated using three iterations of PSI-BLAST and the ones generated from single iteration. The PSI-BLAST (12) searches were carried out against the 50% non-redundant set of the family. The coverage was calculated by checking family associations using HMMER (7) (B) Comparison of coverage obtained when is the representative family profile is generated by performing three iterations of PSI-BLAST searches against the 50% non-redundant set of the family and those obtained when the search is carried out against PFAM seed dataset (3). The coverage was calculated by checking family associations using HMMER. (C) Comparison of coverage obtained using the representatives derived based on 3PFDB+ protocol and those obtained with representatives identified in the earlier work (6). The coverage was calculated by checking family associations using HMMER. (D) Comparison of coverage obtained using the representatives derived based on 3PFDB+ protocol and those obtained with representatives identified in the earlier work (6). The coverage was calculated by checking family associations using FASSM (8).

