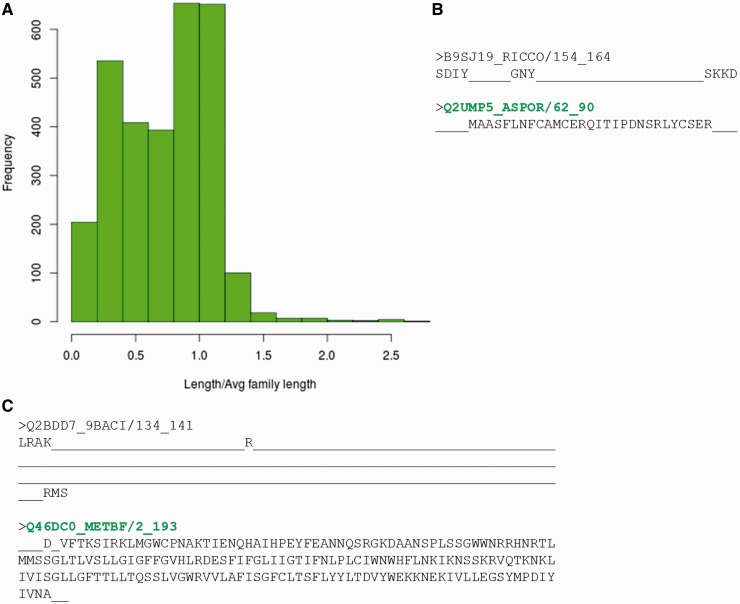
Figure 6.
Sequences which do not recognize their family representatives. (A) Distribution of ratio of length of the sequence not identified by BRPs and average family length. (B, C) Alignment of the sequence not identified by BRP with the sequence of best representative. The PFAM family names are indicated in red and the BRS for these families are highlighted in green.

