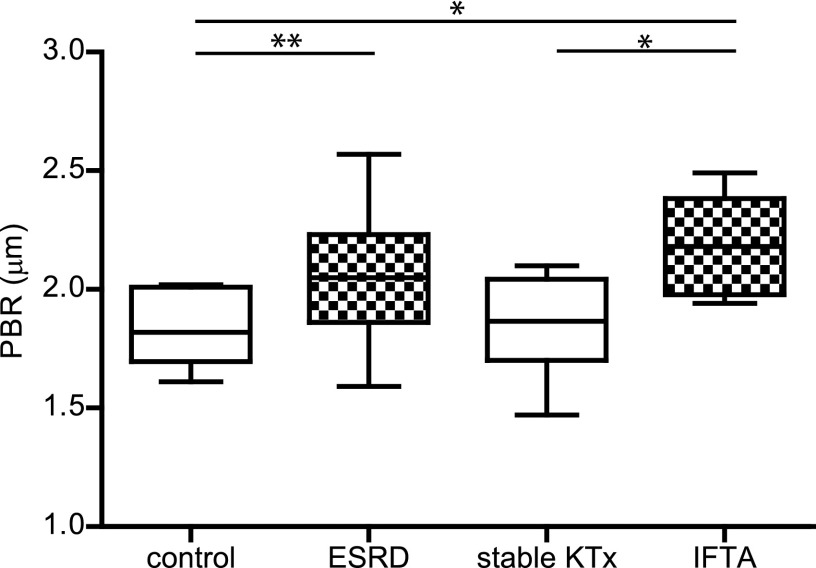
Figure 1.
Measurements of the perfused boundary region (PBR) in participants with and without loss of renal function. PBR in healthy control participants (control; n=10) and patients with ESRD (n=23), stable kidney transplantation (stable KTx; n=12), and interstitial fibrosis and tubular atrophy (IFTA; n=10). Box plot whiskers indicate 1st and 99th percentiles. *P<0.05; **P<0.01.

