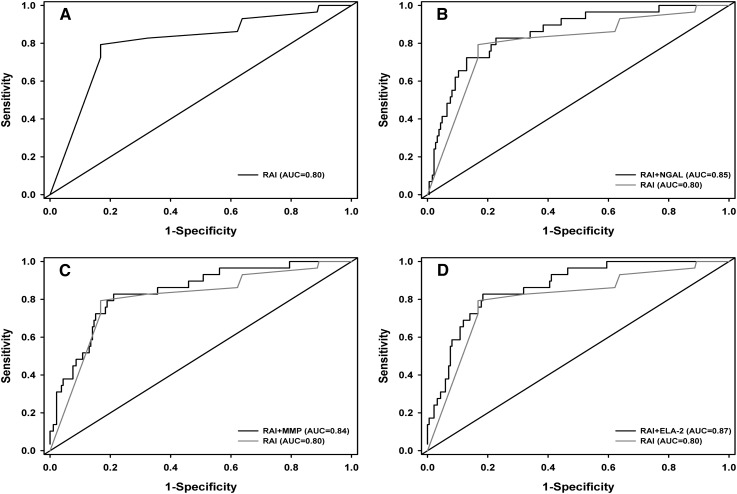
Figure 2.
ROC curves. The four plots represent the ROC curves from the following four prediction models for day 3 AKI: RAI (A), NGAL and RAI (B), MMP-8 and RAI (C), and Ela-2 and RAI (D). The curves in B–D are overlaid with the ROC curve with RAI only (curve in A). Ela-2, neutrophil elastase-2; MMP-8, matrix metalloproteinase-8; NGAL, neutrophil gelatinase–associated lipocalin; ROC, receiver-operating characteristic.

