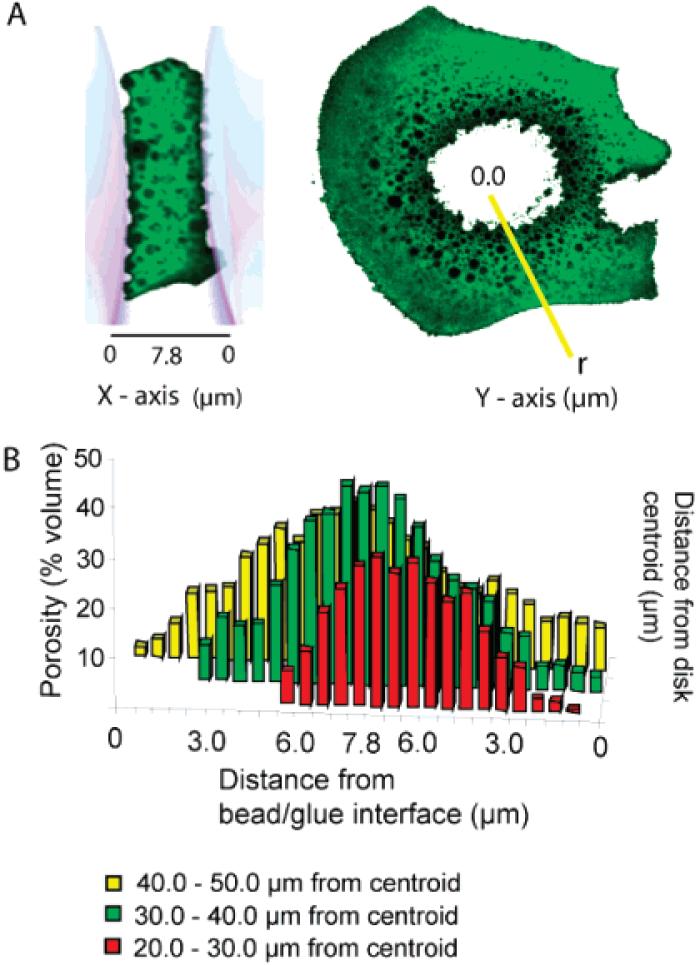
Figure 3.
Porosity (Z-axis) measured as a function of distance from glue-substrate interface (X-axis) and as a function of distance (r) from the centroid of the glue disk (Y-axis). (A) Representative confocal fluorescent images of glue disks and definition of porosity plot axes. (B) Porosity varies as a function of distance from the glue/bead interface and as a function of radial distance (r) from the centroid. For clarity error bars were not added to the bar graph; errors in all cases were less than 10%.

